Comparison of Plant Biodiversity in Primary and Secondary Forest sites in Boca Del Drago, Panama Amara Davila, Sebastian Christakis, Cooper Evans, Niko Segal-Wright, Felipe Matho, Micaela Gernez
The Cambridge School of Weston/Institute for Tropical Ecology and Conservation |
Abstract: We compared biodiversity and species richness within primary and secondary forests sites in Boca del Drago Panama using a random concentric circle quadrat technique. We hypothesized greater biodiversity in the primary forest site. Our hypothesis was generally supported. With the exception of the herbaceous layer. the primary forest had more measured biodiversity and species richness than the secondary forest site.
Introduction: Lowland tropical forests can be divided into two types, primary and secondary. Primary forest is untouched, naturally or unnaturally. It has a full canopy which blocks out the majority of sunlight for understory plants. The understory is usually very sparse, hosting certain plants that can wait years for a light gap which will allow them sufficient energy to grow. Secondary forest has been disturbed in some way whether from a fallen tree, landslide, or logging, allowing vegetation to compete for a new spot in the canopy. A sunlight gap immediately favors very specific quick-growing, sun loving plants such as heliconias, grasses, and ferns. Within the light gap, other the successional trees also compete for the energy of the sun including balsa, cecropia, and palms (Kricher, 1989).
While these are fast-growing species capable closing off the sunlight, they don’t invest resources in chemical defenses, making them susceptible to diseases and infestation. Once these successional species die off other hardier, hardwood species, which can wait many years in the sapling phase for a light gap, are able to take advantage of the sun’s energy and fill in the canopy (Kricher, 1989). In this study we attempted to reaffirm our knowledge of forest structure by examining and comparing both a primary forest and a secondary forest. Based on our knowledge of forest structure our hypothesis was that primary forests contain larger trees and have more biodiversity, while secondary forest exhibits higher species richness and less diversity.
Materials: 5 meter DBH tape, Machete, 50 meter tape, Notebook, Pencil, Folder, Scotch Tape, Compass, Herbarium
Methods: In comparing both a primary forest and a secondary forest we used the random concentric circle quadrat technique (RCCQ). After locating an area of primary forest, we determined the site where we set up our RCCA (random concentric circle area) by selecting a random number and using a compass, set the needle to this random number. We then walked ten steps in this direction and placed a stake in the ground. This was the center of our RCCQ. In order to best sample data one must randomly select a site. Our next step was to assign tasks to our group mates.
The tasks were gthe following: counter (this person counted the different morphospecies and gave samples to the herbarium keeper), herbarium keeper (this person took samples of each morphospecies and taped them into a loose-leaf notebook for future reference), scriber (this person tallied the number of specific morphospecies in a notebook). Our next steps were to measure one meter from the middle of the RCCQ and begin to count the herbaceous species on the floor of the forest within the one meter tract. The counter gave samples of each morphospecies to the herbarium keeper for reference purposes. The counter would also announce the quantity of each morphospecies to the scriber. Once finished with tract one, we measured two meters out from our center point and began counting all morphospecies at breast height (1.23 meters) and under ten centimeters diameter at breast height (DBH). This area is referred to as the understory. We repeated the same recording method used with the herbaceous species on the floor. The herbarium was referenced to compare the leaf structure of these larger plants to see if we had any overlap. Our group then extended the 50 meter tape 5 meters from the center of the RCCQ in order to count the canopy, which consists of trees taller than 1.23 meters and a DBH greater than ten centimeters. Once we finished comparing and counting the morphospecies for the three sections we took the data back to the station for analysis.
The second part of our study was to examine secondary forest repeating the same procedures we had used in the primary. Upon return to the station, we analyzed the data from both trips into the forests. Using Sorensen’s coefficient of community similarity and Margalef’s Indices for determining biodiversity, our group was able to determine and compare the biodiversity and species richness in both types of forest. Results and Discussion Figures 1 through 6 show species richness, meaning they show how much of a single morphospecies we counted out of the total number of plants in the herbaceous, understory, and canopy levels of the primary and secondary forest plots.
Results and Discussion: Figures 1 through 6 show species richness, meaning they show how much of a single morphospecies we counted out of the total number of plants in the herbaceous, understory, and canopy levels of the primary and secondary forest plots.
For the most part, the results of our comparison of primary forests and secondary forests were in agreement with our hypotheses. We hypothesized that the primary forest would have larger trees (a fuller and more mature canopy) and more biodiversity. Because of the extensive structure of the canopy, there would be fewer herbaceous and successional species competing for sunlight. The lack of competition would allow many different species of plants to thrive. We suspect that the lack of a canopy and the concentration of sunlight in a secondary forest would allow for quick growing, sun-loving plants to grow in larger quantities. These fast growing successional plants may overshadow and stunt the growth and numbers of the hardier hardwood plants that may eventually take over the forest. This would mean that our secondary forest would have a lot more vegetation but less variety.
The only part of our results that seemed contradictory to our hypotheses involved the herbaceous level of the secondary forest. We found that this herbaceous level had more biodiversity where we expected to find more individuals of the species of plants. We believe that several things could have caused this odd occurrence. It is possible that the area we chose happened to be unusually diverse and that the small sample of the forest is not a true depiction of secondary forest. It is also possible that the primary forest we chose was actually a secondary forest that had been previously disturbed. A tree might have fallen, or more likely human activity may have disrupted the forest. Another possibility is that the herbaceous layers of secondary forests may indeed be more diverse than those in a primary forest. The herbaceous layer is the least complex in terms of 3-dimensional structure. Disturbance may actually promote diversity in the relatively simple herbaceous layer. Competition may not have had sufficient time to “weed out” inferior competitors, and there may be more species that can potentially inhabit the a higher light levels of the herbaceous layers of the secondary forest as compared to those of the primary forest.
Looking at Figure 2 we see that the herbaceous level of the secondary forest did have a larger number of Morphospecies 15 in comparison to the herbaceous level of the primary forest. The species richness figures (Figures 1 and 2) show this comparison. The table of raw data also shows that the number of species in primary herbaceous level was 14, while the number of species in the secondary herbaceous level was 20. However, our data did show that the secondary forest in the herbaceous level had a larger total number of species than found in primary forest at the herbaceous level. This is in agreement with our hypothesis. Figure #’s 3 through 6 are all in agreement with what we thought would be found in primary and in secondary forest for the understory and canopy levels.
After completing this project we realized there were some sources of error. The biggest question for our group was, is this really a primary forest? It could have been very easy for us to consider the forest as primary when in fact it may have recently been disturbed, contributing to its lack in herbaceous diversity. The other side to this argument is that the secondary forest might have very well been on its way to becoming a primary forest. We have no knowledge of how long ago the secondary forest was disturbed. Another observation was the location of the secondary forest. Prior to the growth of the secondary forest and primary forest, the land had been occupied by banana plantations. This technically means that both forests are considered secondary. This is a significant source of error and may have affected the outcome of our experiment.
Another potential source of error was species identification. We had difficulty remembering the characteristics of each plant we found. For future groups, we suggest (within the herbaceous quadrat only) that you save the full specimen with the roots. This makes it easier to reference your findings and identify other species. We also recommend working around the perimeter of the circle rather than inside the circle to avoid disturbing uncounted plants.
References
Kricher, John C. A Neotropical Companion. Princeton University Press. 1989.
Southerland, William J. Ecological Census Techniques. Cambridge University Press. 1996
http://www.mongas.com. February 22, 2009
Appendix
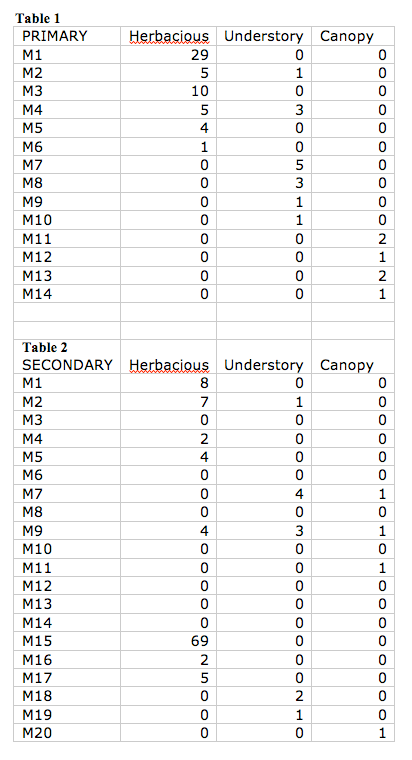
Raw Data: The following tables contain the raw data we collected in all three zones. “M” signifies morphospecies, since we were not always capable of identifying each species of plants we encountered.
|
|
|
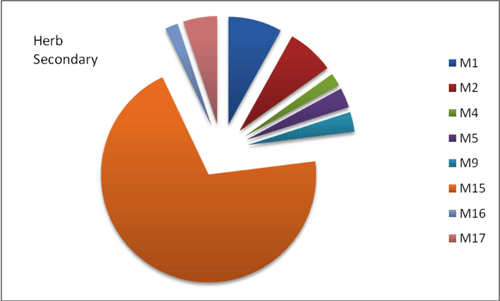 Figure 2 The quantity of individuals of a different species on a one meter tract of the herbaceous level of secondary forest. Morpho species fifteen is almost seventy five percent of the total number of plants of the scondary forest. The other seven species are barely different in there percentages. Figure 2 The quantity of individuals of a different species on a one meter tract of the herbaceous level of secondary forest. Morpho species fifteen is almost seventy five percent of the total number of plants of the scondary forest. The other seven species are barely different in there percentages. |
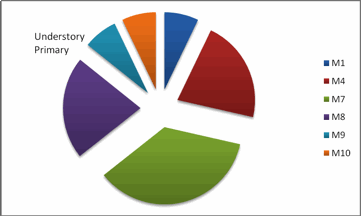 Figure 3 The quantity of individuals of a different species on a two meter tract of the understory level of primary forest. Morpho species four and eight are identical in amount and seven is only a tiny bit more. The other species are equal and overall there is not too much of a difference in quantity of the different species. Figure 3 The quantity of individuals of a different species on a two meter tract of the understory level of primary forest. Morpho species four and eight are identical in amount and seven is only a tiny bit more. The other species are equal and overall there is not too much of a difference in quantity of the different species. |
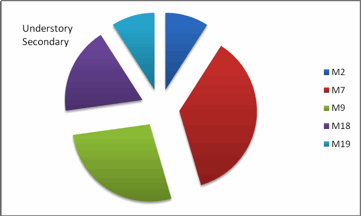 Figure 4 The quantity of individuals of a different species on a two meter tract of the understory level of the secondary forest. The species are all very similar in percentages with morphospecies seven being about three times morphospecies nineteen. Figure 4 The quantity of individuals of a different species on a two meter tract of the understory level of the secondary forest. The species are all very similar in percentages with morphospecies seven being about three times morphospecies nineteen. |
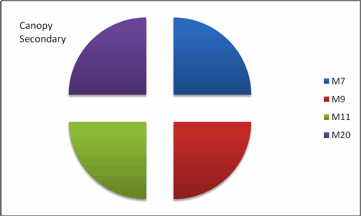 Figure 5 The quantity of individuals of a different species on a five meter tract of the canopy of the secondary forest. All the species have equal amounts exactly. Figure 5 The quantity of individuals of a different species on a five meter tract of the canopy of the secondary forest. All the species have equal amounts exactly. |
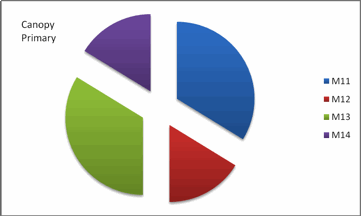 Figure 6 The quantity of individuals of a different species on a five meter tract of the canopy in the primary forest. Morphospecies thirteen and eleven are equal and the other to are about as half as large and identical in quantity. Figure 6 The quantity of individuals of a different species on a five meter tract of the canopy in the primary forest. Morphospecies thirteen and eleven are equal and the other to are about as half as large and identical in quantity. |
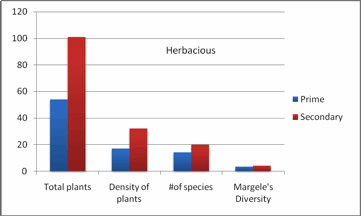 Figure 7 This graph shows that there were almost twice as many herbaceous plants, more densely compact, and diverse, with a larger number of species in the secondary forest than the herbaceous plant growth in the primary forest. Figure 7 This graph shows that there were almost twice as many herbaceous plants, more densely compact, and diverse, with a larger number of species in the secondary forest than the herbaceous plant growth in the primary forest. |
 Figure 8 This graph shows that there was higher understory plant growth, more densely compact, and diverse, with more types of species in the primary forest than the understory plant growth in the secondary forest Figure 8 This graph shows that there was higher understory plant growth, more densely compact, and diverse, with more types of species in the primary forest than the understory plant growth in the secondary forest |
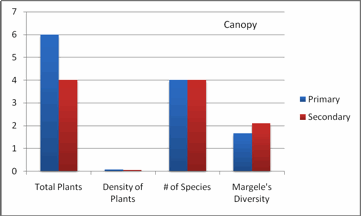 Figure 9 This graph is similar to the previous understory plant growth graph, in that the primary forest had more total number of plants, more densely compact and diverse, with a higher number of total species than that of the secondary forest. Figure 9 This graph is similar to the previous understory plant growth graph, in that the primary forest had more total number of plants, more densely compact and diverse, with a higher number of total species than that of the secondary forest. |
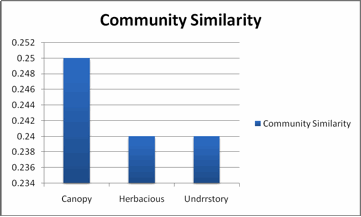 Figure 10 This graph depicts the percentage of similar vegetation between the primary forest and secondary forest within the three zones we observed. For example, in the herbaceous level 25% of the vegetation was the same between the two forest types and 75% was not Figure 10 This graph depicts the percentage of similar vegetation between the primary forest and secondary forest within the three zones we observed. For example, in the herbaceous level 25% of the vegetation was the same between the two forest types and 75% was not |
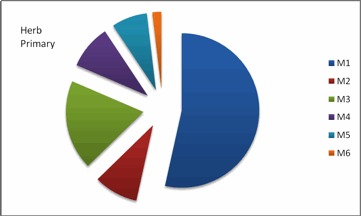 Figure 1 The quantity of individuals of different species within a one meter tract of the herbaceous level of the primary forest. Morphospecies one is slightly more than fifty percent of the total number of plants on the forest floor while the other species vary in quantity.